
How to Read a Hospital ICU Monitor: A Comprehensive Guide
Intensive Care Unit (ICU) monitors are essential tools for healthcare professionals to continuously track a patient’s vital signs and physiological functions. These advanced devices provide real-time data, enabling medical staff to make informed decisions and intervene promptly when necessary. However, for those unfamiliar with ICU monitors, interpreting the information displayed can be challenging. This comprehensive guide aims to demystify the process of reading a hospital ICU monitor, covering the various parameters, waveforms, and alarm systems. We will also include a FAQ section and a summary table for quick reference.
Understanding ICU Monitor Basics
1.1 Purpose of ICU Monitors
ICU monitors are designed to provide continuous, non-invasive monitoring of a patient’s vital signs and physiological functions. They help healthcare professionals detect any changes or abnormalities in the patient’s condition, allowing for early intervention and improved patient outcomes.
1.2 Common Parameters Displayed
A typical ICU monitor displays various parameters, including:
- Heart rate (HR)
- Respiratory rate (RR)
- Blood pressure (BP)
- Oxygen saturation (SpO2)
- Body temperature
- Electrocardiogram (ECG)
- Invasive blood pressure (IBP)
- Central venous pressure (CVP)
- Intracranial pressure (ICP)
- Cardiac output (CO)
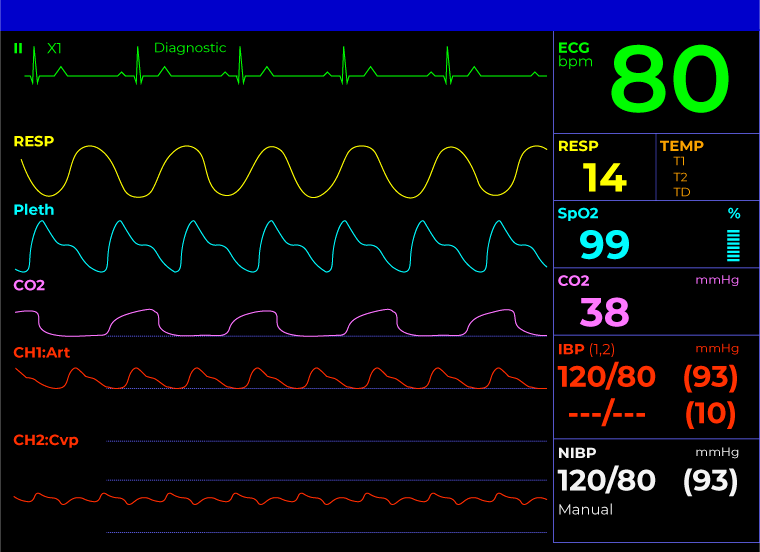
1.3 Monitor Layout and Components
ICU monitors generally have a split screen layout, with numerical values displayed on the right side and waveforms on the left. The screen may also include information about alarm settings, patient identification, and time.The monitor is connected to the patient via various sensors, such as ECG electrodes, pulse oximeter, and blood pressure cuff. These sensors transmit data to the monitor, which processes and displays the information in real-time.
Interpreting Numerical Values
2.1 Heart Rate (HR)
The heart rate is typically displayed in beats per minute (bpm) and should fall within the normal range of 60-100 bpm for adults. Bradycardia (HR < 60 bpm) or tachycardia (HR > 100 bpm) may indicate an underlying condition or abnormality.
2.2 Respiratory Rate (RR)
The respiratory rate is measured in breaths per minute (bpm) and should be between 12-20 bpm for adults at rest. Abnormal respiratory rates may be a sign of respiratory distress or other medical conditions.
2.3 Blood Pressure (BP)
Blood pressure is displayed as two numbers: systolic pressure (top number) and diastolic pressure (bottom number). Normal blood pressure ranges from 90/60 mmHg to 120/80 mmHg. Hypotension (low BP) or hypertension (high BP) may require intervention.
2.4 Oxygen Saturation (SpO2)
Oxygen saturation measures the percentage of hemoglobin in the blood that is saturated with oxygen. Normal SpO2 levels should be between 95-100%. Values below 90% may indicate hypoxemia and the need for supplemental oxygen.
2.5 Body Temperature
Body temperature is displayed in degrees Celsius or Fahrenheit. Normal body temperature ranges from 36.5°C to 37.5°C (97.7°F to 99.5°F). Fever (temperature above 38°C or 100.4°F) or hypothermia (temperature below 35°C or 95°F) may be a sign of infection or other medical conditions.
Interpreting Waveforms
3.1 Electrocardiogram (ECG)
The ECG waveform represents the electrical activity of the heart. It consists of P waves, QRS complexes, and T waves, which correspond to the contraction and relaxation of the atria and ventricles. Abnormalities in the ECG waveform may indicate cardiac arrhythmias or other heart-related issues.
3.2 Respiratory Waveform
The respiratory waveform, also known as the impedance pneumogram, reflects changes in thoracic impedance caused by breathing. It can help identify respiratory patterns and detect any abnormalities, such as apnea or irregular breathing.
3.3 Pulse Oximetry (SpO2) Waveform
The SpO2 waveform, also known as the plethysmographic waveform, represents the changes in blood volume in the tissue. It can provide information about the patient’s perfusion and help identify any issues related to oxygen delivery.
3.4 Invasive Blood Pressure (IBP) Waveform
The IBP waveform displays the pressure in the arteries or veins, measured directly through an indwelling catheter. It can provide more accurate and continuous blood pressure monitoring compared to non-invasive methods.
Understanding Alarm Systems
4.1 Purpose of Alarms
ICU monitors are equipped with alarm systems that alert healthcare professionals when a patient’s vital signs or physiological parameters fall outside the normal range. Alarms help ensure timely intervention and prevent adverse events.
4.2 Types of Alarms
ICU monitors typically have two types of alarms:
- High Priority Alarms: These alarms indicate life-threatening situations, such as cardiac arrest or respiratory failure. They are usually accompanied by loud, high-pitched sounds and flashing lights.
- Medium Priority Alarms: These alarms signal potential issues that require attention but are not immediately life-threatening. They are typically accompanied by lower-pitched sounds and less intense visual cues.
4.3 Responding to Alarms
When an alarm is triggered, healthcare professionals should immediately assess the patient’s condition and take appropriate action. This may include adjusting medication, providing supportive care, or initiating emergency procedures.
Summary Table
| Parameter | Normal Range |
|---|---|
| Heart Rate (HR) | 60-100 bpm |
| Respiratory Rate (RR) | 12-20 bpm |
| Systolic Blood Pressure | 90-120 mmHg |
| Diastolic Blood Pressure | 60-80 mmHg |
| Oxygen Saturation (SpO2) | 95-100% |
| Body Temperature | 36.5°C to 37.5°C (97.7°F to 99.5°F) |
For more detailed information on ICU monitoring, you can refer to the Wikipedia page on Intensive Care Medicine.
FAQ Section
1. What is the purpose of an ICU monitor?
ICU monitors are used to continuously track a patient’s vital signs and physiological functions in the Intensive Care Unit. They help healthcare professionals detect any changes or abnormalities in the patient’s condition, allowing for early intervention and improved patient outcomes.
2. What parameters are typically displayed on an ICU monitor?
Common parameters displayed on an ICU monitor include heart rate, respiratory rate, blood pressure, oxygen saturation, body temperature, ECG, invasive blood pressure, central venous pressure, intracranial pressure, and cardiac output.
3. How do I interpret the numerical values on an ICU monitor?
The numerical values on an ICU monitor represent the patient’s vital signs and physiological parameters. Each parameter has a normal range, and values outside this range may indicate an underlying condition or abnormality. For example, a heart rate below 60 bpm (bradycardia) or above 100 bpm (tachycardia) may require attention.
4. What do the waveforms on an ICU monitor represent?
The waveforms on an ICU monitor represent various physiological functions, such as the electrical activity of the heart (ECG), changes in thoracic impedance caused by breathing (respiratory waveform), changes in blood volume in the tissue (SpO2 waveform), and pressure in the arteries or veins (IBP waveform).
5. How do I respond to alarms on an ICU monitor?
When an alarm is triggered on an ICU monitor, healthcare professionals should immediately assess the patient’s condition and take appropriate action. This may include adjusting medication, providing supportive care, or initiating emergency procedures. High priority alarms indicate life-threatening situations and require immediate attention.
Conclusion
Reading an ICU monitor is a crucial skill for healthcare professionals working in the Intensive Care Unit. By understanding the various parameters, waveforms, and alarm systems, medical staff can make informed decisions and provide timely interventions to improve patient outcomes. This comprehensive guide has provided an overview of how to read an ICU monitor, but it is essential to receive proper training and supervision when working with these advanced devices in a clinical setting.